Experimental and theoretical study of fluid dynamics
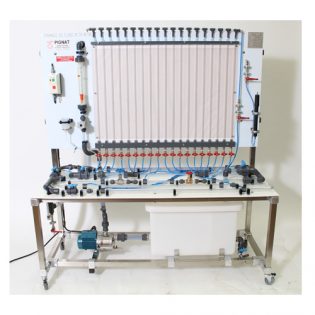
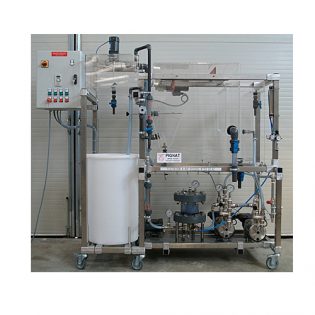
NEW BECH – NEW CONCEPTION
GENERAL SPECIFICATIONS
- SS centrifugal pump with On/Off switch.
- Storage Tank.
7 parallel pipe-lines
- Plexiglas Venturi.
- Plexiglas diaphragm.
- Needle valve.
- Rough piping, equipped with four quick fitting connectors.
- Pipe with ink injection.
- Piping brutal narrowing, brutal enlargement, Series of four 90° bends.
- Smooth piping equipped with four quick fitting connectors.
- Smooth piping equipped with four quick fitting connectors.
- Manual vacuum pump.
Instrumentation
- Flowmeters.
- Differential pressure transmitter.
- Manual differential pressure manometer.
- Manometers.
- Digital indication temperature.
Dim: 260 x 70 x 180cm
SS tubular framework 40 x 40mm
Study of pressure drops across various components
Valves, elbows, abrupt changes in pipe diameter
Pipes of different diameter, length and roughness
Comparison between flow rate measurement techniques
Flowmeter
Orifice measurement (Venturi and diaphragm)
Filling rate measurement
Comparison between experimental and theoretical values
Theoretical pressure drop calculations
This unit for fluid dynamics and study of energy loss is composed of various straight hydraulic
pipes of different diameters and material.The unit has the same specificities commonly encountered
in industrial hydraulic networks: elbows, valves, venturi meters for the measurement of flow rate,
and abrupt narrowing or widening of the tubes, etc.
This system functions in a closed circuit and the fluid circulation is generated by a centrifugal pump.
The measurement of energy loss is made by a differential pressure sensor.
The teaching objectives of the study are to:
– compare the flow rate measurement methods e.g. flow meter, orifice-meter (diaphragm), and venturi meter.
– verify the law of turbulent flow in the form dP = k Qv2
– determine, for each length or irregularity, the energy loss expressed:
o in equivalent length of a reference tube
o in terms of energy loss coefficient z
These different values will be compared qualitatively and quantitatively with respect to the different charts given in the literature.







 PIGNAT et ses partenaires utilisent des Cookies strictement nécessaires, de navigation et marketing et publicitaires. Pour plus d'informations, consultez notre “politique de cookies". Acceptez le dépôt de tous nos cookies en cliquant sur "J'accepte" ou sélectionnez les catégories de cookies déposés en cliquant sur "Voir les préférences” sinon refusez nos cookies non strictement nécessaire en cliquant sur "Je refuse”.